This scenario examines web traffic over a TCP network. To simulate this case, we defined six nodes:
node 0 is the client that will request a web page from the web server.
node 1 is the client's router.
node 2 is the web cache's primary router.
node 3 is the web cache's secondary router.
node 4 is the web cache server.
node 5 is the web server.
The web cache (node 4) is connected to a web server (node 5) through a router (node 3). The web client (node 0) is connected to web cache (node 4) with connection routed through the client's router (node 1). To simulate this case scenario, you need the script shown in Listing 2.
When executing ns ./tcpweb.tcl, you will obtain two windows: the network animator and the simulation window. Figure 5 shows a possible layout of the nodes in simulation window. To get an accurate picture of traffic from client, bandwidth graphs for the link between nodes 1 and 2 are displayed.
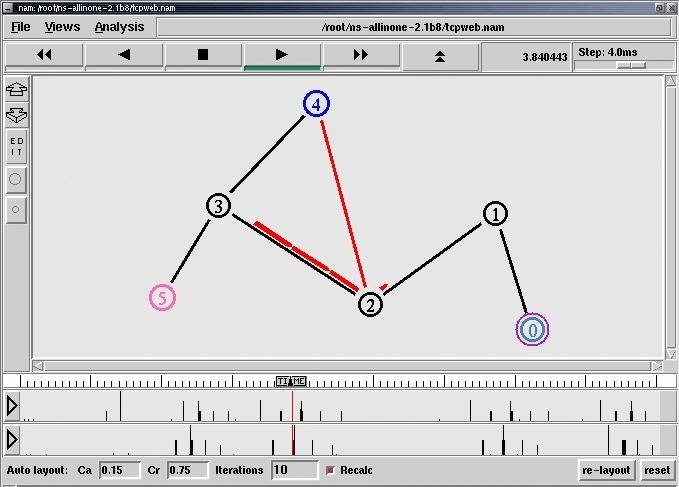
Figure 5. Dynamic Rerouting of Packets
Link failure occurs between nodes 2 and 4 (Figure 5) as defined by the following lines:
$ns rtmodel-at 3 down $lrmon3 $lmcrt1
$ns rtmodel-at 7 up $lrmon3 $lmcrt1
Packets that were on the link are lost and must be retransmitted. After failure, notice the break in packet traffic in the bandwidth graphs. TCP packets are now taking another path from web cache to web client. Yet the connection is not lost because of the failure, since we can see that packets are still being exchanged between client and cache. If the display of nodes is not to your liking, you can change it using the Re-layout function button in the simulator window. While playing the simulation, you can change the step using the slider bar. This will be especially useful during the link failure between three and seven seconds to see dropped packets.
Another interesting aspect of this scenario is the visual server-cache and client-cache interaction. You can see a model of real-time common interactions on the Internet. Of course, bear in mind that this is a generalized simulation.
If you prefer a graphical interface to setup network simulations, NAM supports a drag-and-drop user interface. You can place network nodes, link them together and define user agents and their associated application or traffic generator. SCTP is not included in this interface because the patch was specific to NS2 source code, not NAM. NAM is useful for quickly building a network topology. However, we experienced multiple segmentation faults during editing (back up your files often).
The following example explains how to use basic NAM features. The first step is to start an instance of NAM by executing ./nam. Selecting New in the file menu, you will see the editor window appear. For this example, we are trying to build the topology seen in Figure 6.
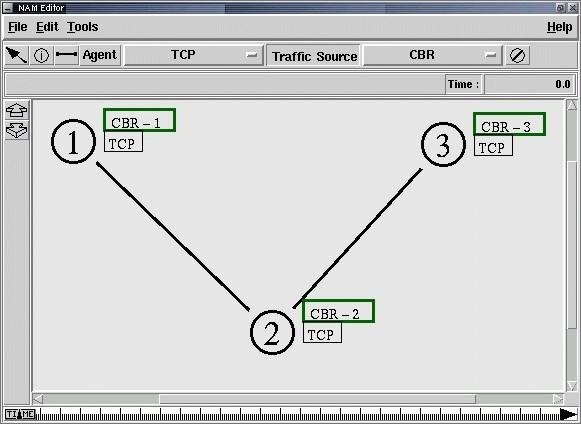
Figure 6. NAM Editor
On the toolbar, click on the Add node button and place three nodes in editor window by right clicking at the correct positions. To link nodes, click on Add link. Select one node and drag-click to the next node to create link. Next, choose which agents you want to use on network in agent drop-down menu. To add an agent, click on the appropriate node. Lastly, you choose what applications you want to simulate: either FTP or CBR source. To add an application, click on the chosen agent. At this point, you can right click on different elements in your topology and edit their properties such as color or start and end time for applications. If you get a dialog saying that you must connect your agents, use Add link and connect different agents to simulate your scenario. In case of a blunder, there is a delete button on the toolbar. Note that editor and simulation windows are both part of NAM, but simulation must first be interpreted by NS2 so that NAM can replay the log of simulation.


Tidak ada komentar:
Posting Komentar